Many of our customers need to configure TopBraid EDG to meet their unique requirements. TopBraid EDG is a low-code solution. This means that many types of configurations and customizations of EDG do not require programming.
For example, EDG supports ability to do the following without a need to write a single line of code:
- Customize panel layouts
- Personalize form displays
- Pre-define search columns and filters
- Create custom reports as saved queries and searches
- Define custom asset types and custom attributes and relationships
- Create custom workflow templates
- And more …
Having said this, there are and always will be customizations that require some amount of coding. With TopBraid EDG release 6.4, we are making this even easier than before – through a new feature called Active Data Shapes scripting.
Basically, each asset in TopBraid EDG now has pre-generated object oriented APIs that can be used in standard JavaScript. TopBraid EDG includes a runtime JavaScript engine that will interpret these programs. Once written, a script can be declared as an option of the asset’s menu.
Using this approach, you can make available a very broad set of custom actions, including:
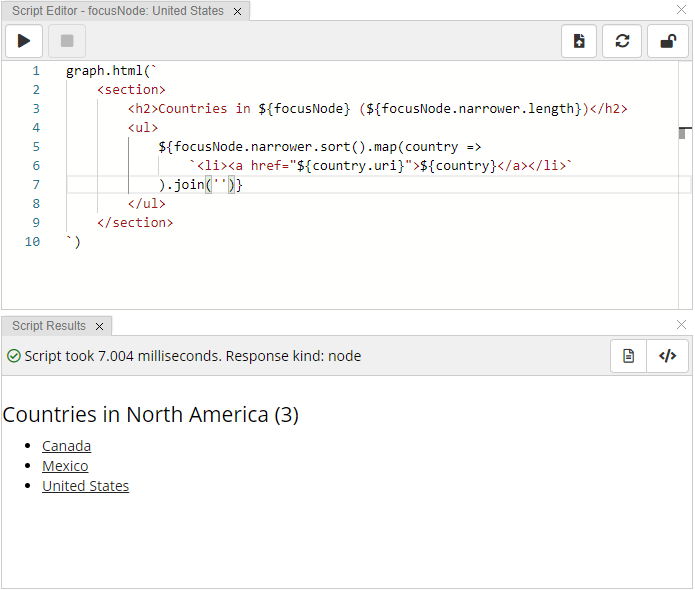
- Custom reports. See this image for a small example.
- Custom importers. This video walks you through a tutorial on how to do this. For more details and if you prefer textual guidance, see this tutorial.
- Any type of action that asks a user to provide some input and performs any operation using the input – as explained in this tutorial.
How does this work?
Each asset in EDG has an API generated from the model that defines it. For example, if a data asset in EDG has a property called acronym, you can access and modify the property values in JavaScript using focusNode.acronym. You can iterate in JavaScript across a set of focus nodes e.g., all Data Elements and perform other typical operations.
This is made possible by integrating into TopBraid EDG the runtime GraalVM engine – as shown in the below architecture diagram:

The use of the Data Graph term in this diagram follows SHACL terminology. In other words, it can be any asset collection that contains your data e.g., a taxonomy, a glossary, a data asset collection, etc. Shapes Graph refers to ontologies – asset collections that contain shape definitions.
To let you interactively write and test ADS scripts directly in your browser, TopBraid EDG offers a number of new panels such as Script Editor and Script Results.
How can you get started with ADS?
Once you install TopBraid EDG 6.4, go to the Server Administration > Server Configuration and enable ADS scripting. It is a new feature in 6.4 and, thus, needs activating. Starting with the next release, it will be activated by default.
The above links provide you with direct pointers to specific examples. For a broad overview, go to this page. And if you would like to start with a video overview, take a look at this webinar, forward to 40:15 minutes to get to a point where ADS scripting is introduced
Try following one or more of the examples and let us know if you have questions and/or have requests for additional examples.